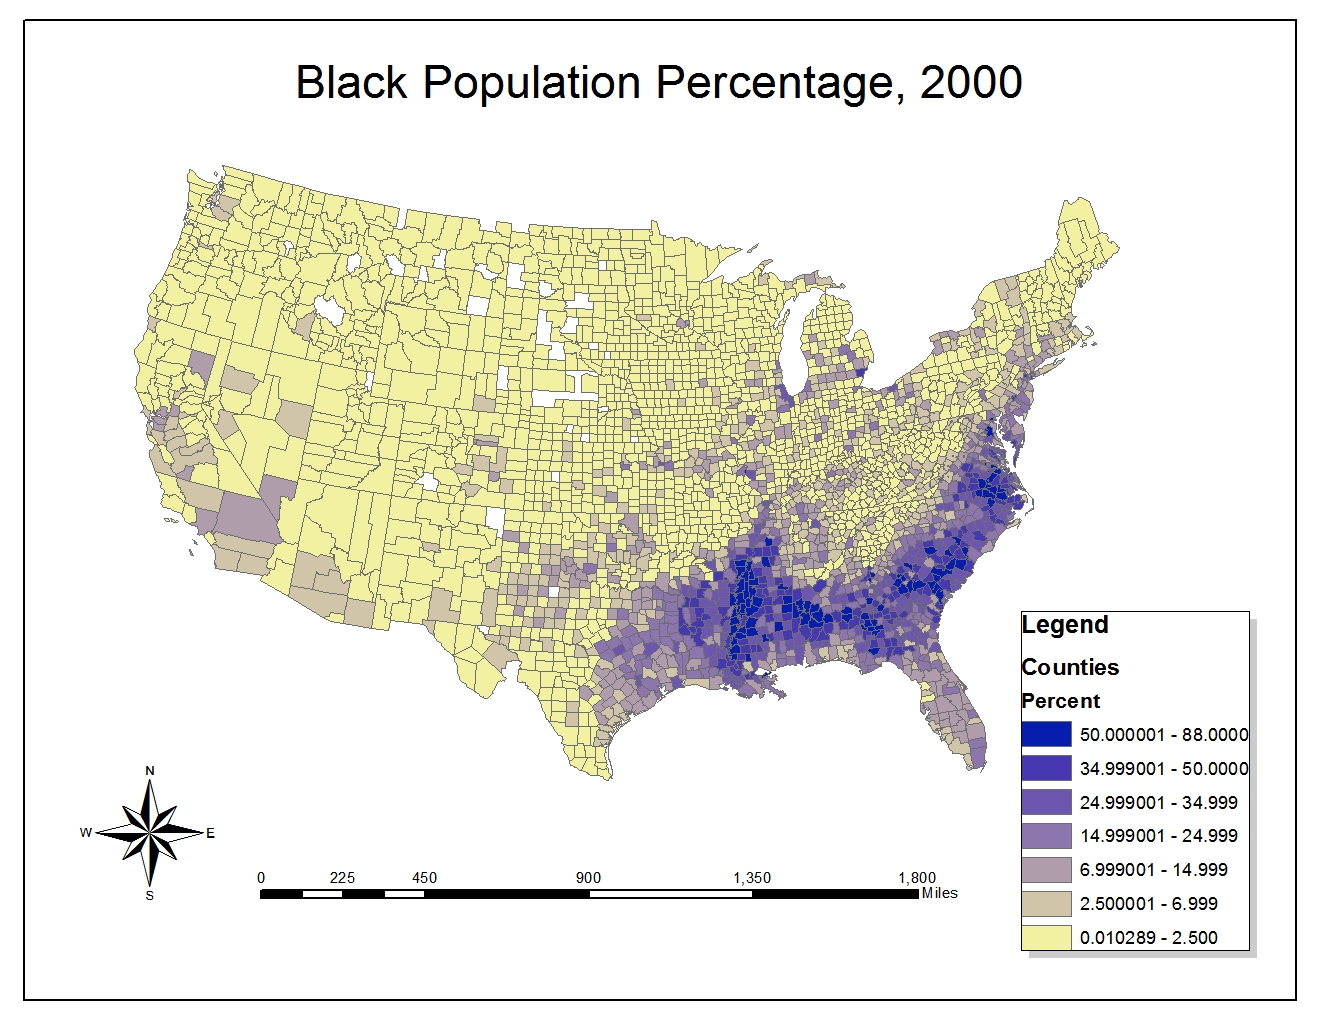
I created three population maps this week from census data from 2000. I decided to try out different map layouts to see how each looked.

The Black population map in the United States can be seen above. The Black population is clearly the largest in the Southeast. This comes from pre-Civil War era where the high concentration of African slaves was in the South working on plantations. Much of these Black populations did not migrate far, and so have remained in the Southeastern United States in high percentages. There is also a higher percentage of Black population in California, known for being more diverse and generally have higher minority percentages. Also it is interesting to note that in more recent years, the black population growth rate for the black population "surpasses U.S. average" according to an article in the Business Journals, an online news site.
The Asian population is very heavily represented on either coast, at most often urban centers. The west coast is particularly dense because the ports in the West are were many Asian immigrants arrived. These populations often arrive in the United States from this direction and have been migrating out from these areas since. It is also noteworthy that the highest percent population was around 46%, indicating that there are not any particular counties that have an incredibly high percentage of Asians. Likewise, in the whole country, it can be seen that the percentage of Asian population is rather low in most states not located on the West Coast. It is interesting to note that the Asian populations in the last ten years has grown considerably, tending to very between 40-80% growth every year, according to an article written based on the 2010 census.Other races distribution can be seen heavily influenced by the Hispanic populations. It can easily be seen that all of the states bordering Mexico have the highest percentages of other races. This is most likely immigrants from Mexico, Central America and South America that are arriving in the border states such as Texas and California. This is why these counties have the highest percentage. In the North, a small amount of immigrants that come through Canada can be identified around the Washington area. Also, most likely from Caribbeans, there are some higher concentrations seen in some parts of Florida. Overall, the Mideast and Northeast have very tiny percentages.
This map series provides very interesting perspective on the percentage populations of different regions throughout the U.S. In fact, a quick slideshow where the maps are aligned could quickly give an idea of the overall distribution of populations in the United States. After reviewing the maps I created, I have concluded that I believe the third map is the most visually appealing. The blue background and varied, but intense colors used as identifiers makes it stand out among the other two. It is also important to note how effective at ArcGIS was at helping to create these maps. Joining data from tables can be incredibly powerful, as there is a lot of data collected in table format not necessarily for maps, but with ArcGIS, they can be used to create maps by importing them and joining them to the geographical data we have already collected.
Reference:
1. "Growth rate for black populations", Thomas, Scott. Business Journals. <http://www.bizjournals.com/bizjournals/on-numbers/scott-thomas/2012/10/growth-rate-for-black-population.html?page=all>
2. Campbell Gibson; Kay Jung (September 2002). "Historical Census Statistics on Population Totals By Race, 1790 to 1990, and By Hispanic Origin, 1970 to 1990, For The United States, Regions, Divisions, and States". Population Division. United States Census Bureau. Retrieved 17 November 2012.


No comments:
Post a Comment